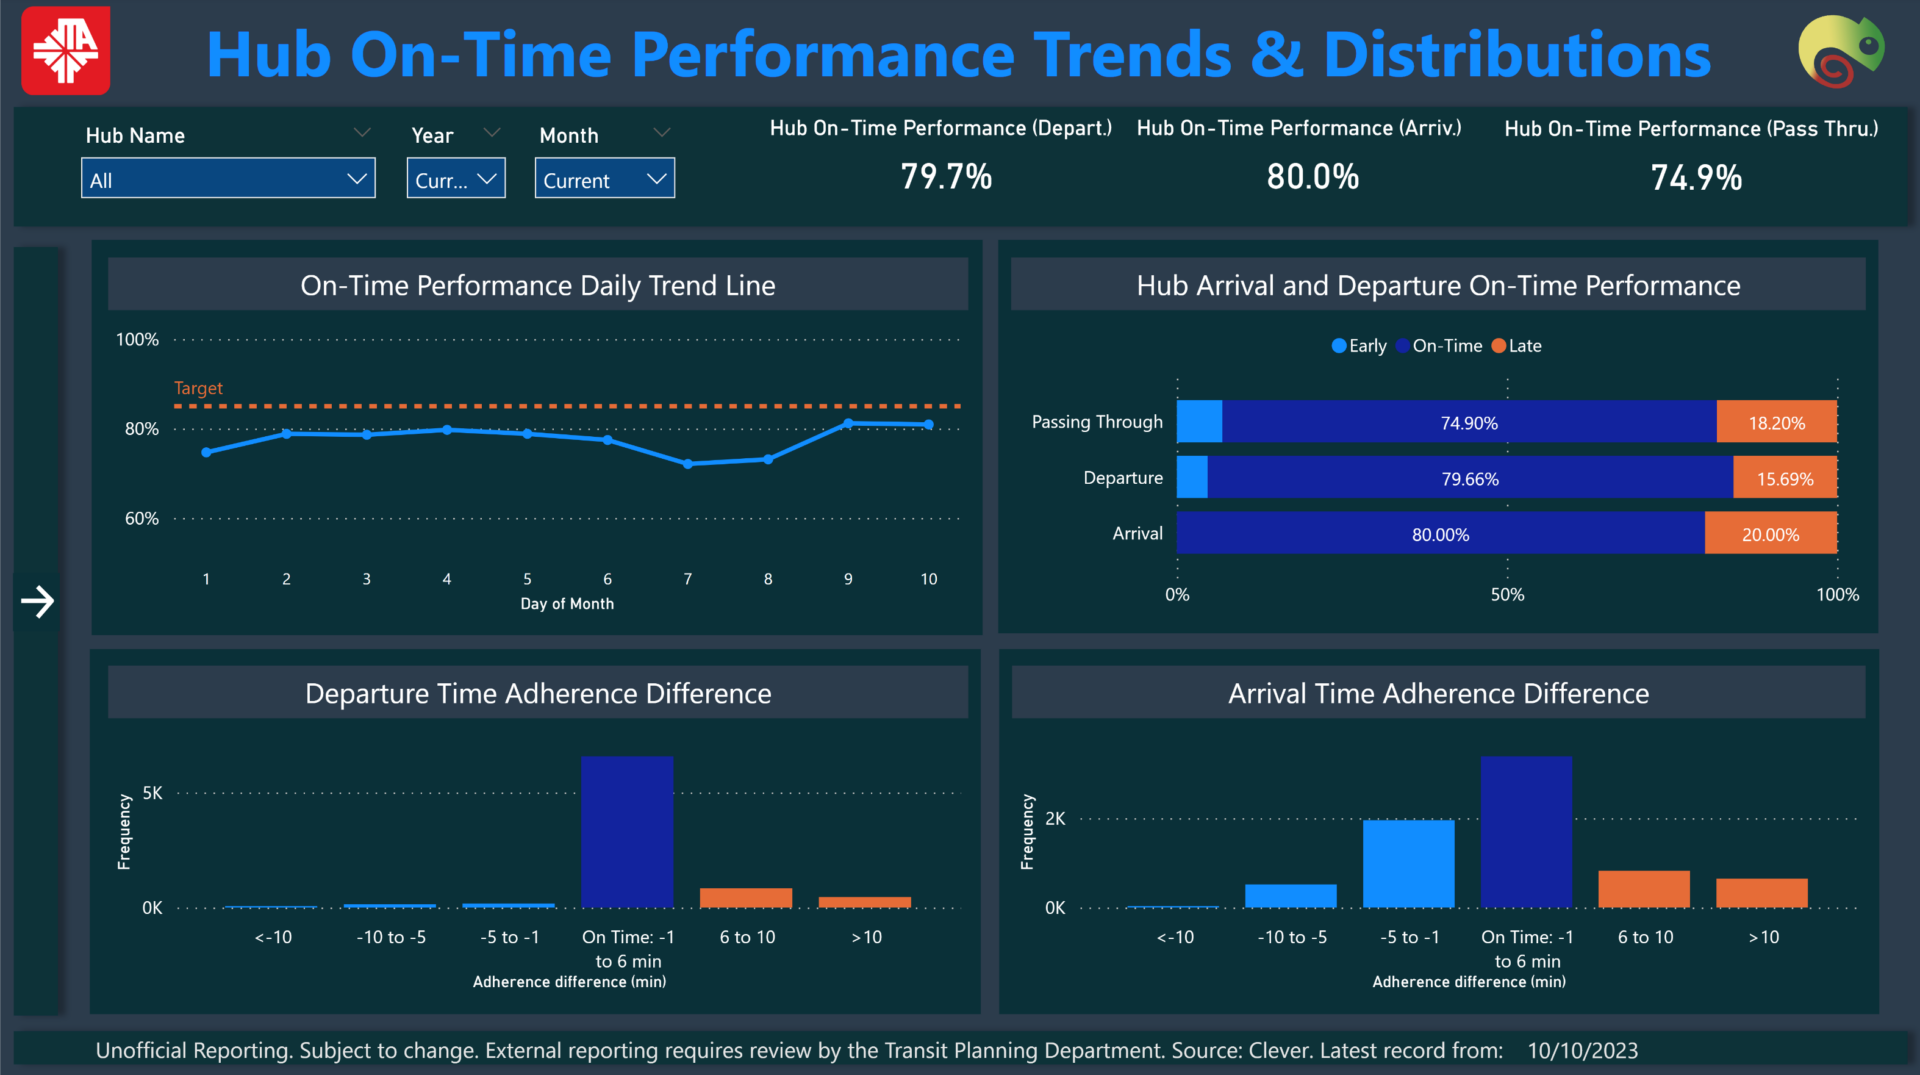
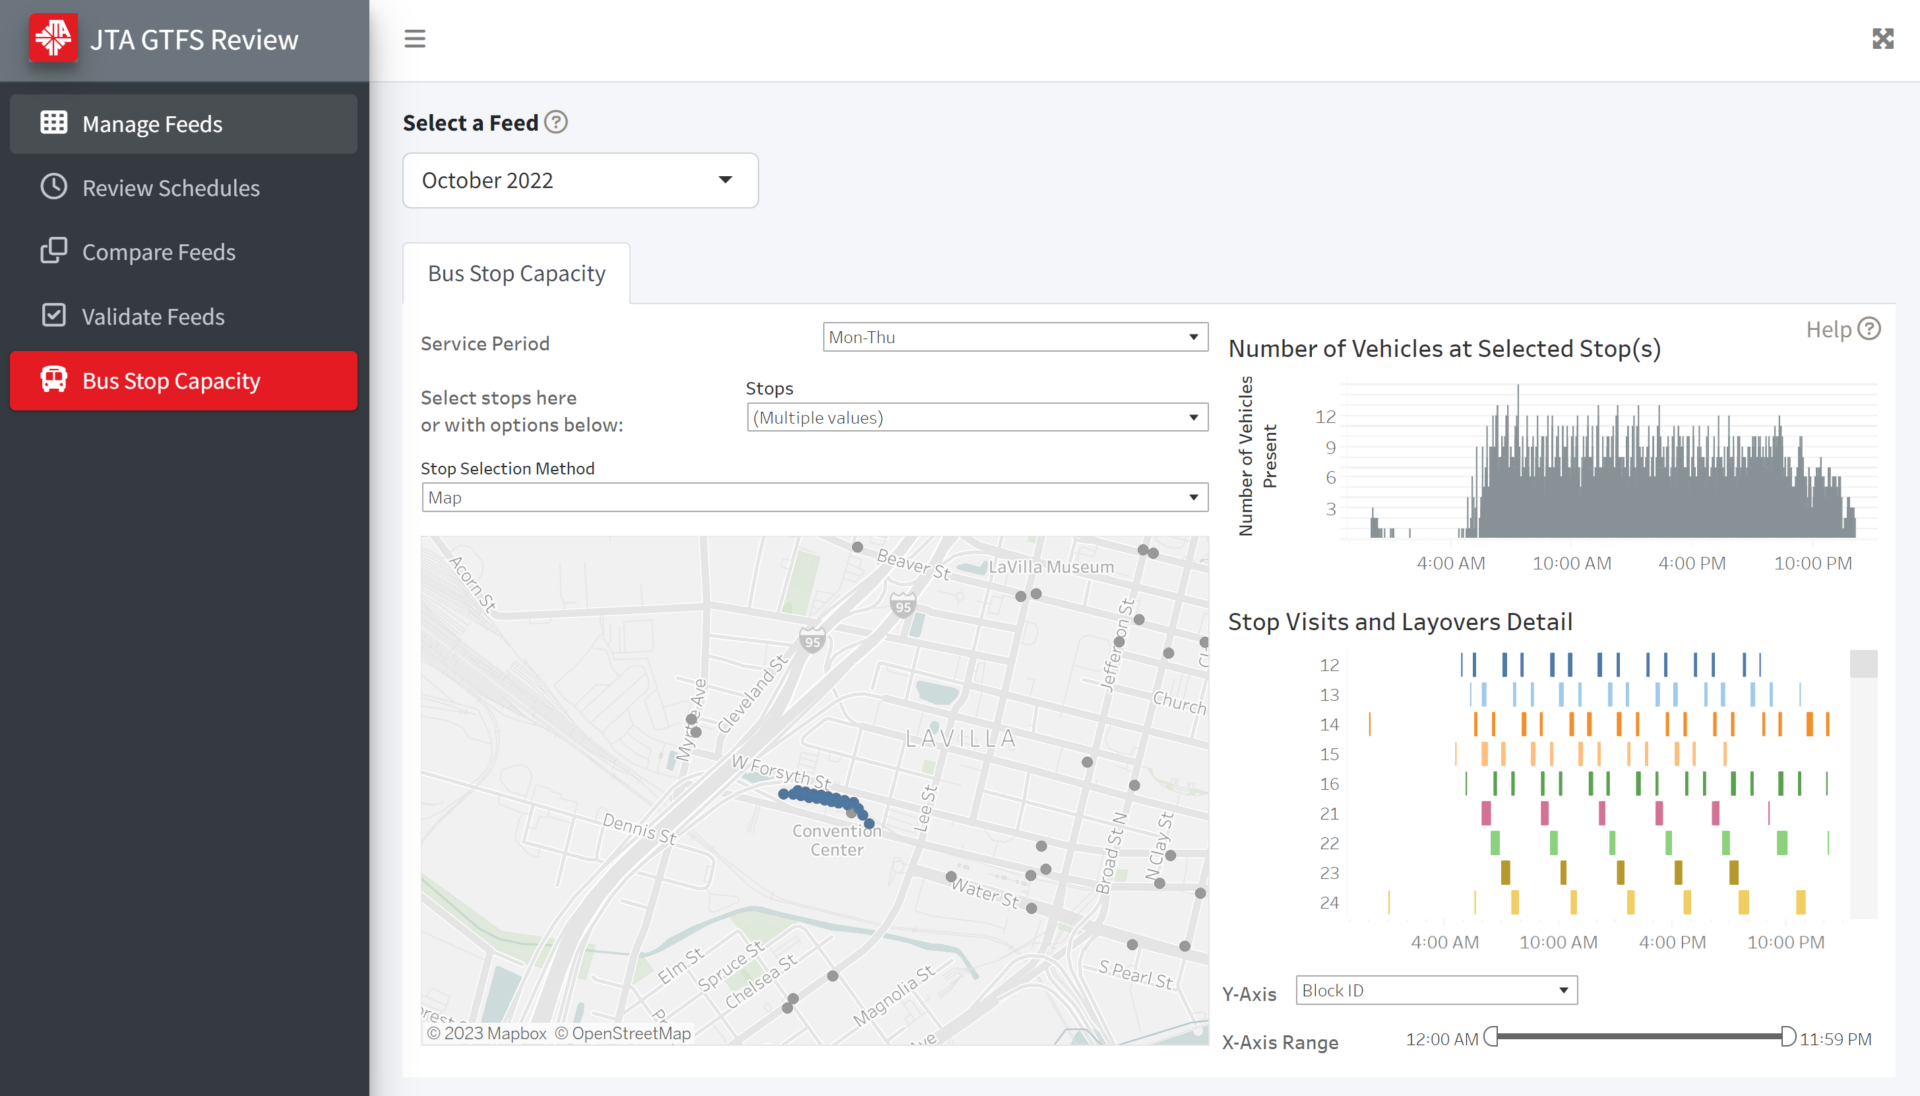
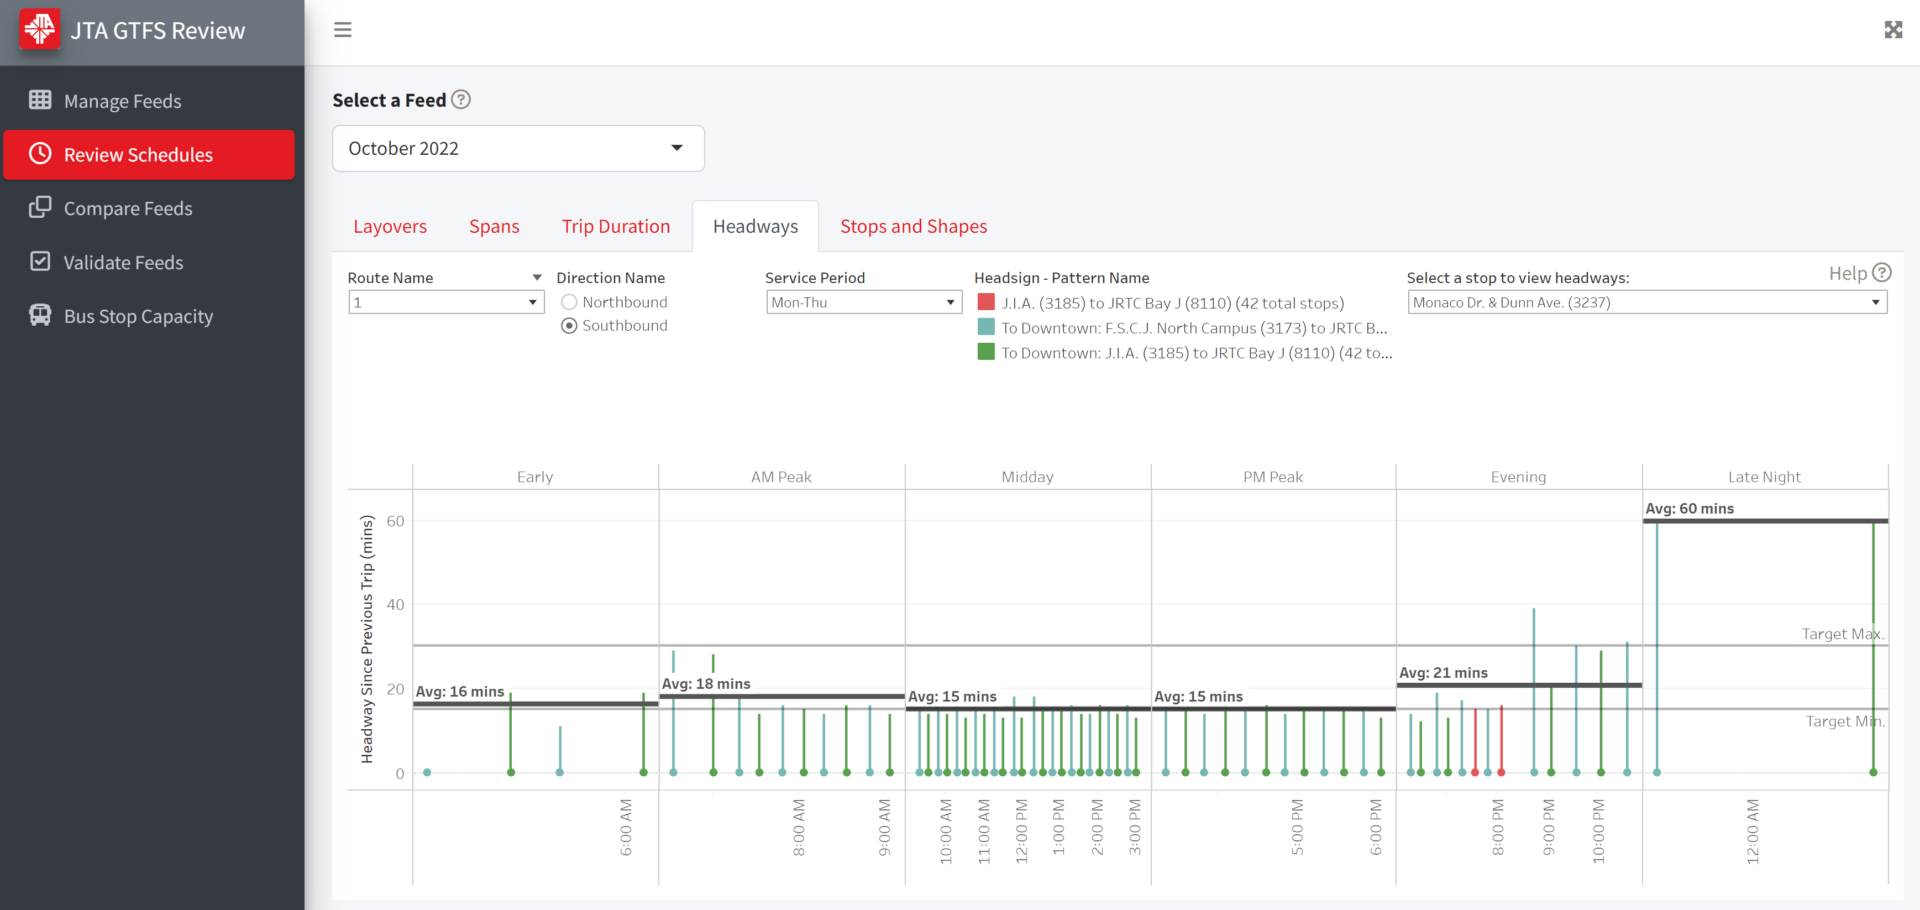
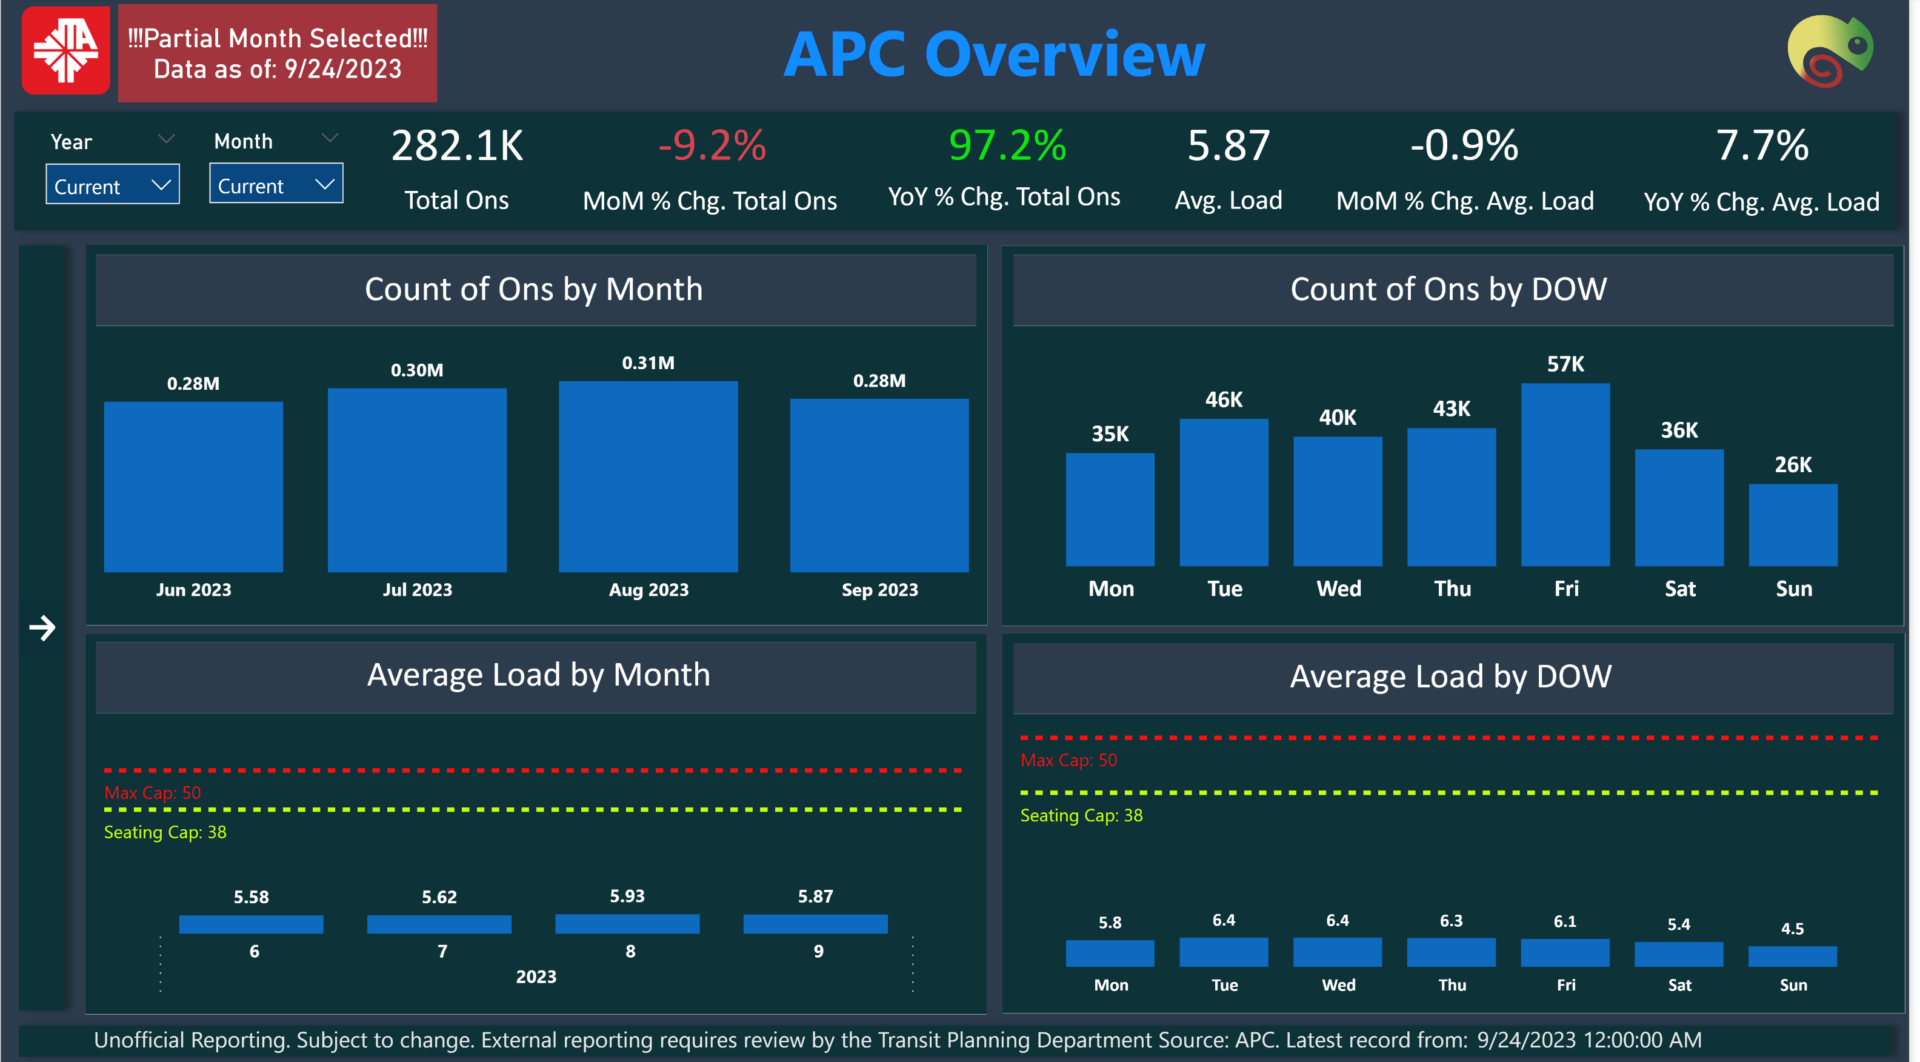
JTA engaged Foursquare ITP and our consultant team to assess how its bus service is scheduled and to implement new dashboards to improve monitoring of schedule development and operations. Amid a shortage of operators and its use of complex interlining, JTA faced a series of on-time performance challenges, especially for on-time departures from transit centers. Foursquare ITP developed a set of operational dashboards using live connections to JTA’s passenger counter and vehicle location data and deployed our proprietary Reflect dashboards that support QA/QC of schedules, GTFS feeds, and transit center capacity.
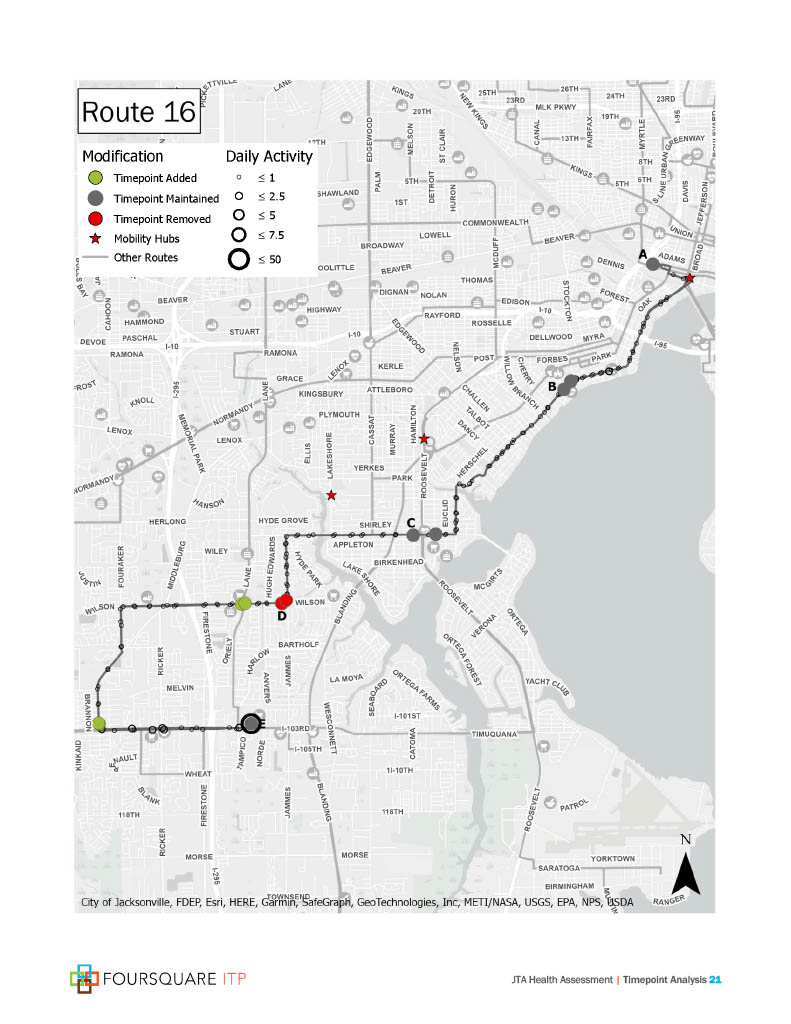
Foursquare ITP’s QA/QC tools help JTA identify too-short layovers, bus stop capacity challenges, and other runtime issues that can affect on-time performance. Other aspects of Foursquare ITP’s QA/QC suite help to ensure quality GTFS feeds to improve customer service and the quality of data sent to tools like Google Maps. The operational dashboards developed by Foursquare ITP also help to identify how late pull-outs from JTA garages can affect on-time performance on subsequent trips. Finally, Foursquare ITP assessed JTA’s existing timepoint locations and proposed new ones to address overly long timepoint segments and identify new places where operators could hold for schedule adjustments.
JTA has new insights on the causes of poor on-time performance at its transit centers, such as capacity conflicts, late pullouts, and other factors. JTA is using the GTFS validation tools to quickly diagnose and address issues before publishing its GTFS feeds.
Solutions and Outcomes
- Developed operational dashboards, which included vivid illustrations of JTA’s ridership recovery using data feeds from JTA’s APC database.
- Created drill-down analyses of on-time performance at transit centers, including dashboards that link on-time pull-outs from JTA’s garage to on-time performance on subsequent trips.
- Deployed “Reflect” GTFS and Schedule QA/QC dashboards to help JTA create high-quality, error-free transit schedules.